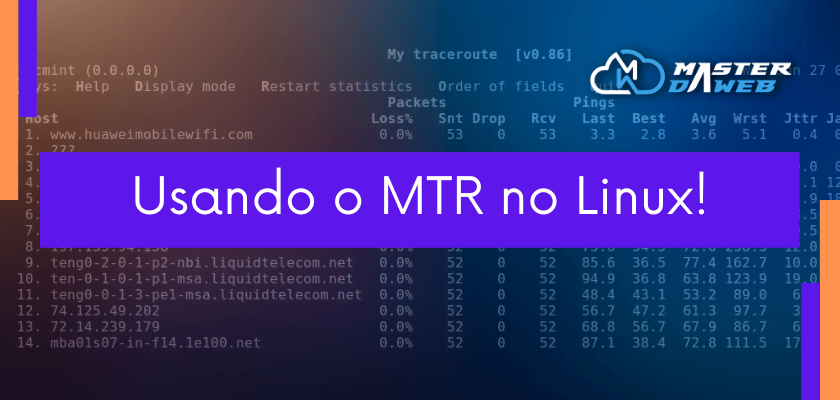
Using MTR on Linux!

In today’s post we’ll show you a bit more about MTR and how to use it in a Linux distribution.
As we mentioned in another post, MTR is a network diagnostic tool that combines the functionalities of traceroute and ping in a single command.
In Linux, this tool is used via the command line and is available in most distributions. To use it, simply type the following command into the terminal:
mtr (IP ou nome do Host)When you run the command, MTR will display a list of all the routers between your device and the destination host and the latency between them. It automatically updates the information every few seconds, allowing you to monitor the network in real time.
You can also use additional options with the MTR command to customize the output. For example, the -n option prevents the MTR from trying to resolve hostnames into IP addresses, which can save time on networks with many devices, the -c option defines the number of packets the MTR will send for each hop and the -z option shows the number of ASs for each router.
mtr -n -z -c 10 masterdaweb.comIn the example above, 10 packets will be sent for each hop between the device and the Web Master server and will only show the IP addresses and AS numbers of each router.
There are more options to use in your tests, type the following command to display:
mtr -hAll this shows how MTR is a powerful and easy-to-use tool, very useful for identifying network problems, it can help you identify the root cause of latency problems, packet loss and incorrect routing in your network.
See also our video tutorial available on our YouTube channel:
Master da Web, your cloud solution! ☁️